Levi Gans
Most people meet OTLP as a line in a config file. A vendor’s setup page says “set OTEL_EXPORTER_OTLP_ENDPOINT”, you paste it, and data shows up. Until it doesn’t, and you’re staring at a 404 on a URL you never typed.
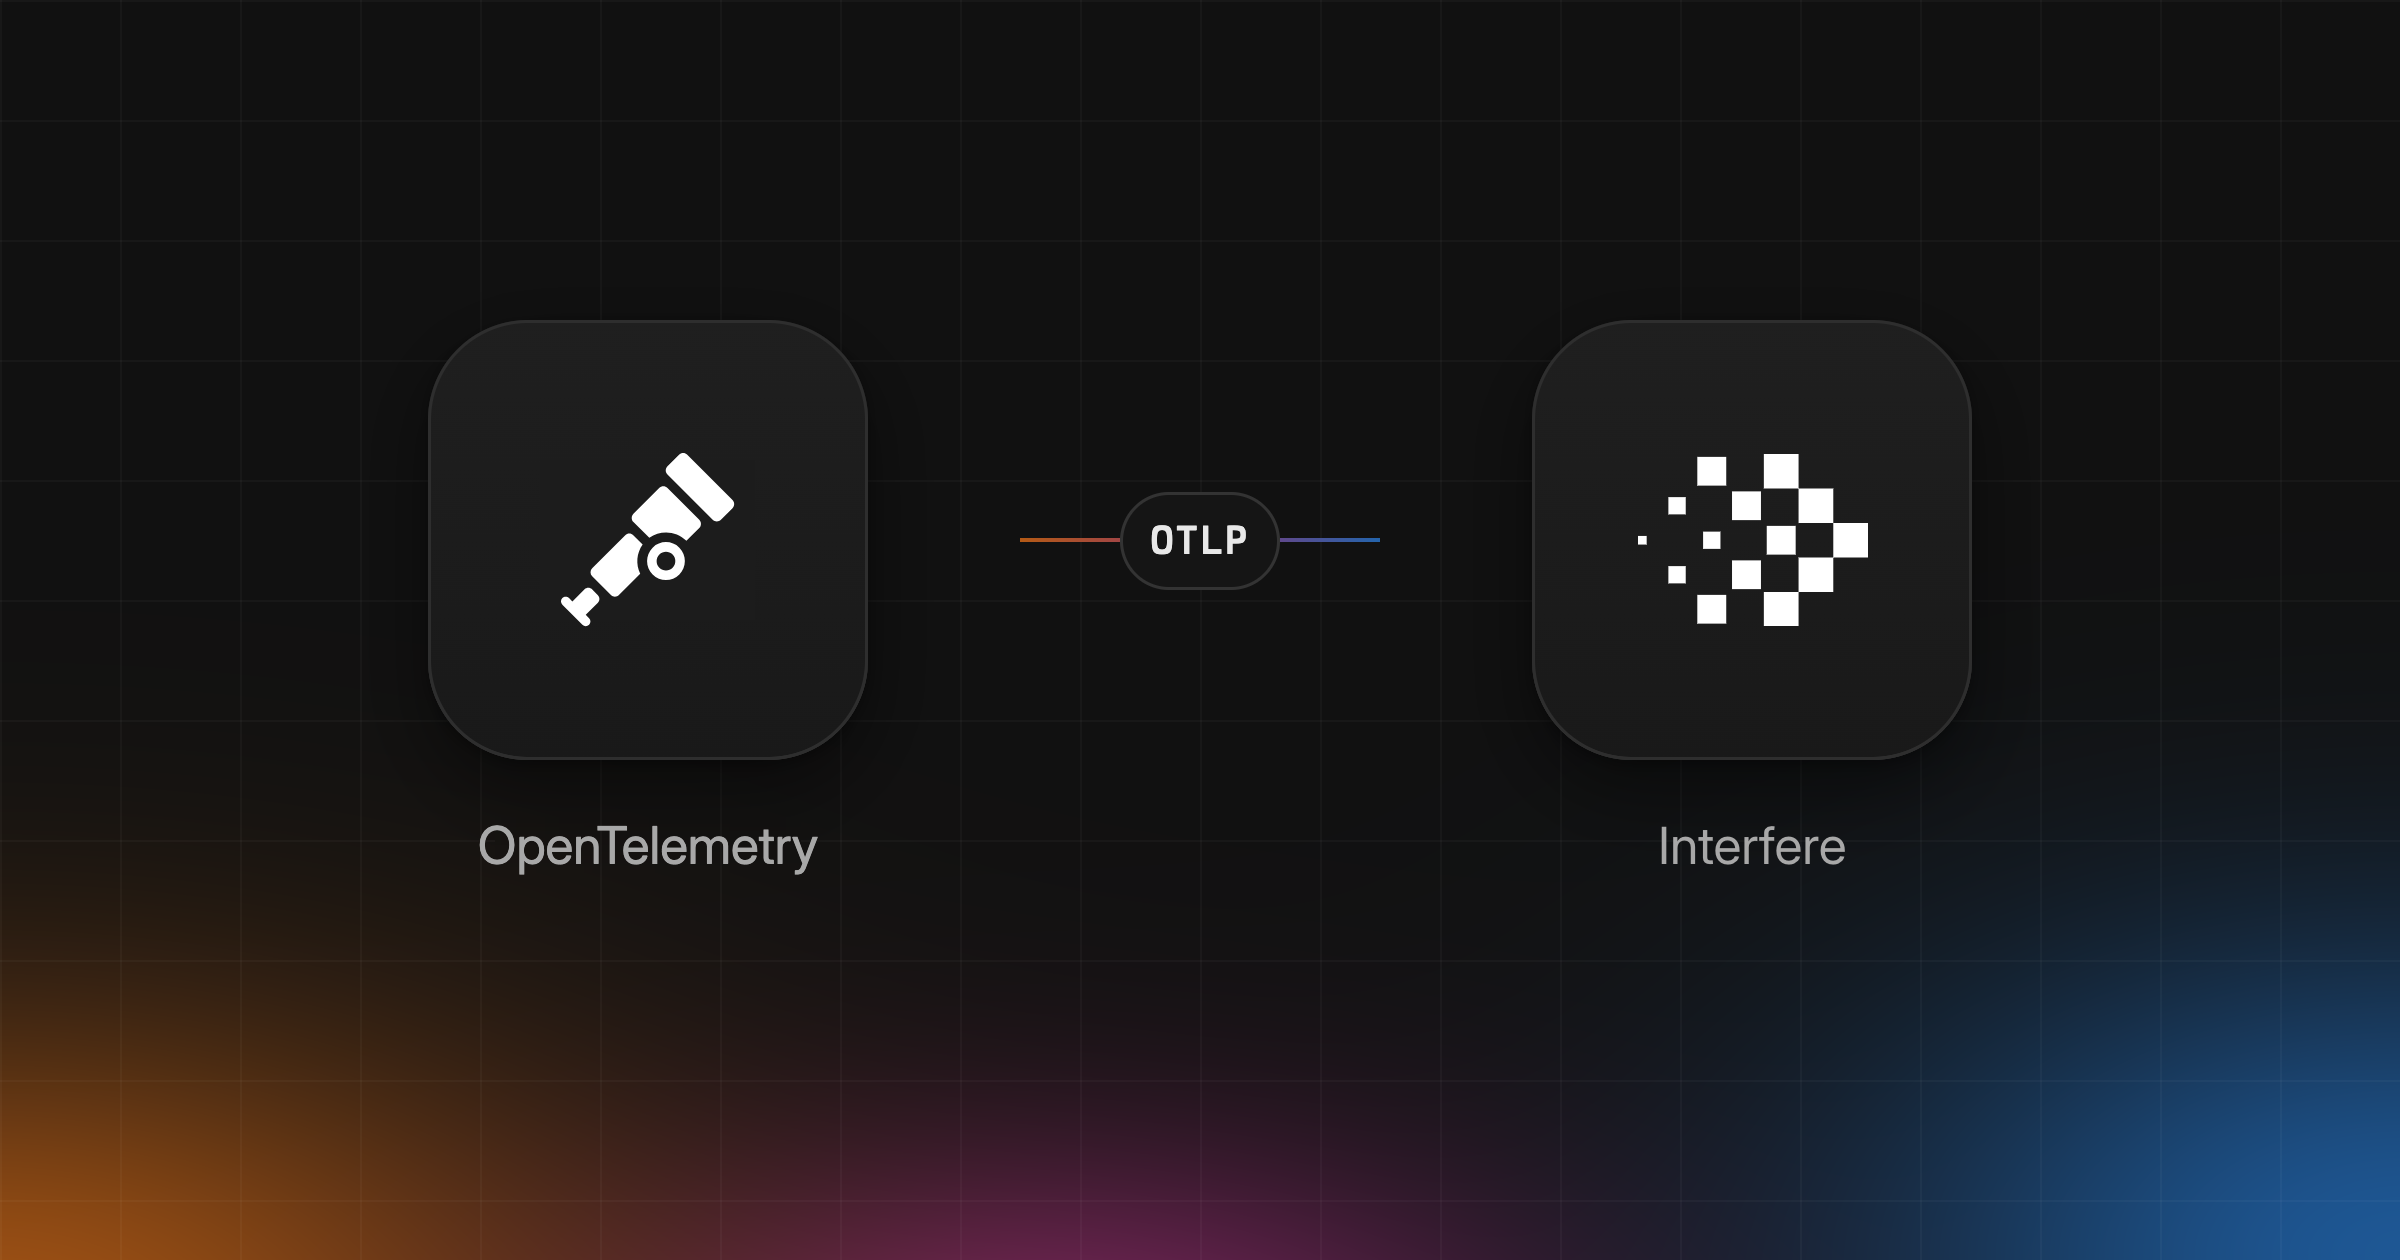
OTLP is the OpenTelemetry Protocol. It defines how telemetry travels from the thing that produces it to the thing that stores it. Once you know its handful of rules, most of those 404s explain themselves.
What is OTLP?
OTLP is the wire format and transport that OpenTelemetry uses to move traces, metrics, logs and profiles between SDKs, Collectors and backends. The specification lives on opentelemetry.io, and the Protobuf schemas and the spec source live in open-telemetry/opentelemetry-proto on GitHub.
It covers three things:
- The data model, as Protobuf messages like
ExportTraceServiceRequestandExportLogsServiceRequest. - The transport, which is either gRPC or HTTP.
- The behavior around a request: success, partial success, which errors to retry and how to back off.
That third part is the one people skip, and it’s the part that decides whether you lose data during an outage.
OTLP doesn’t decide what to measure. Instrumentation does that. OTLP only carries the result. That’s why one service can switch from Honeycomb to Grafana Cloud by changing an endpoint and a header, with no code changes.
Signals and stability
The spec marks itself Stable for the trace, metric and log signals, and Development for the profiles signal. The proto repository’s maturity table says the same for both encodings.
| Signal | Binary Protobuf | JSON | Default HTTP path |
|---|---|---|---|
| Traces | Stable | Stable | /v1/traces |
| Metrics | Stable | Stable | /v1/metrics |
| Logs | Stable | Stable | /v1/logs |
| Profiles | Development | Development | /v1development/profiles |
Profiles still use a v1development package because, in the spec’s words, “incompatible changes to its Protobuf schema remain possible”. So if a vendor says it accepts OTLP, assume traces, metrics and logs at most. Then check, because many accept fewer.
Transports and encodings
OTLP runs over gRPC or HTTP. Over HTTP, the body is either binary Protobuf or JSON. The exporter spec gives these three the names you’ll type into OTEL_EXPORTER_OTLP_PROTOCOL:
grpc, protobuf over a gRPC HTTP/2 connection.http/protobuf, protobuf over HTTP, sent withContent-Type: application/x-protobuf.http/json, JSON over HTTP.
OTLP JSON is not quite the JSON you’d guess. Trace and span IDs are hex strings, not base64. Enum values must be integers, not names. Keys are lowerCamelCase. Hand-written JSON payloads trip on the enum rule most often.
The exporter spec says SDKs should default to http/protobuf unless they have a backward-compatibility reason to default to grpc. The Node.js SDK defaults to http/protobuf.
OTLP ports and URL paths
The default port for OTLP/gRPC is 4317. The default port for OTLP/HTTP is 4318. Both come straight from the spec, and the exporter defaults are http://localhost:4317 and http://localhost:4318.
Those ports are for local Collectors and agents. Hosted vendors usually listen on 443 like any HTTPS API. Honeycomb’s gRPC endpoint is https://api.honeycomb.io:443, for example.
Over HTTP, each signal goes to its own path: /v1/traces, /v1/metrics and /v1/logs. gRPC has no paths. It calls a service method per signal, which is why the OpenTelemetry docs warn against adding /v1/traces to a gRPC endpoint.
One more thing that bites people. The Collector’s OTLP receiver binds to localhost:4317 and localhost:4318 by default. In a container, other services can’t reach localhost, so you’ll need to set the receiver endpoint yourself.
OTLP gRPC vs HTTP
| OTLP/gRPC | OTLP/HTTP | |
|---|---|---|
| Protocol value | grpc | http/protobuf, http/json |
| Default port | 4317 | 4318 |
| Encoding | Binary Protobuf | Binary Protobuf or JSON |
| Signal routing | Service method per signal | URL path per signal |
| Retryable errors | Codes like UNAVAILABLE | 429, 502, 503, 504 |
| Spec’s SDK default | Only for backward compatibility | Yes, http/protobuf |
Which one should you use? If the backend accepts both, either works. If you send to more than one vendor, HTTP is the safer default, because some vendors don’t take gRPC at all. Datadog’s OTLP traces intake says it plainly: “grpc is not supported.” Interfere doesn’t accept it either.
The OTLP exporter environment variables
Every OpenTelemetry SDK reads the same set of variables, defined in the exporter spec. Each one has a shared form and a per-signal form with TRACES, METRICS or LOGS in the middle.
Every name below starts with OTEL_EXPORTER_OTLP_.
| Variable | What it sets | Default |
|---|---|---|
_ENDPOINT | Base URL for all signals | Port 4318 or 4317 |
_PROTOCOL | Transport and encoding | http/protobuf |
_HEADERS | Request headers | None |
_COMPRESSION | gzip or none | No value; SDK picks |
_TIMEOUT | Batch export time, with retries | 10s |
Spelled out, with their defaults:
1OTEL_EXPORTER_OTLP_ENDPOINT=http://localhost:4318 # HTTP; gRPC uses http://localhost:43172OTEL_EXPORTER_OTLP_PROTOCOL=http/protobuf # or grpc, http/json3OTEL_EXPORTER_OTLP_HEADERS= # format: key1=value1,key2=value24OTEL_EXPORTER_OTLP_COMPRESSION= # gzip or none; unset lets the SDK pick5OTEL_EXPORTER_OTLP_TIMEOUT=10s # total time per batch export, retries included
The protocol default of http/protobuf is the spec’s recommendation. The per-signal versions look like OTEL_EXPORTER_OTLP_TRACES_ENDPOINT and OTEL_EXPORTER_OTLP_LOGS_HEADERS. A per-signal variable always wins over the shared one.
Headers use the W3C Baggage format, so values get URL-encoded. A bearer token becomes Authorization=Bearer%20<token>, with %20 standing in for the space.
The path-appending rule
This is the rule behind most OTLP 404s.
When you set OTEL_EXPORTER_OTLP_ENDPOINT, the SDK treats it as a base URL and appends v1/traces, v1/metrics or v1/logs. So http://collector:4318/mycollector/ sends traces to http://collector:4318/mycollector/v1/traces.
When you set a per-signal variable like OTEL_EXPORTER_OTLP_TRACES_ENDPOINT, the SDK uses the URL as-is. It appends nothing. If you set it to http://collector:4318, traces go to the root path /, not /v1/traces.
So the shared variable takes the base URL and the per-signal variable takes the full URL. Grafana’s docs spell out the same thing for its gateway, which suggests this catches plenty of people.
Compression, partial success and retries
Compression is gzip or nothing. The spec names gzip as the only supported method. Over HTTP, a gzipped body carries Content-Encoding: gzip.
A 200 doesn’t always mean everything landed. If the server accepted only part of a batch, it still returns success but fills in a partial_success field with counts like rejected_spans or rejected_log_records and an error message. The client must not retry that request. In practice, that means rejected records only show up as a warning in your exporter logs, if you look.
For real failures, the spec splits errors into retryable and not:
- Over HTTP, retry only
429,502,503and504. Every other4xxor5xxmust not be retried, and a400means the data was bad. - If the server sends
Retry-After, the client should wait that long. - Otherwise, retries use exponential backoff with jitter.
- All attempts and waits fit inside
OTEL_EXPORTER_OTLP_TIMEOUT, which defaults to10s. When that runs out, the exporter stops trying and the export fails.
That last point surprises people. Ten seconds, retries included, is the whole budget for a batch. A backend outage longer than that costs you data from every service that exports to it directly.
Collector or direct export?
You can export from your service straight to a vendor, or send everything to an OpenTelemetry Collector and let it forward.
Direct export is one less thing to run. It suits serverless functions, small services and getting started. The cost is that every service holds the vendor’s endpoint and key, and the SDK’s short retry window is all the buffering you get.
A Collector gives you one place to batch, retry with a queue, drop noisy attributes, sample, and fan out to several backends. Datadog recommends an Agent or Collector for production and its direct intake “when deploying a Collector or Agent is not feasible”. Grafana says much the same, steering direct SDK export toward development, testing, or setups without a Collector.
Our take: start direct, add a Collector when you have more than a few services or more than one destination.
Which vendors accept OTLP, and how
| Vendor | Signals | gRPC | Auth header |
|---|---|---|---|
| Honeycomb | Traces, metrics, logs | Yes | x-honeycomb-team |
| Grafana Cloud | Traces, metrics, logs | Not documented | From stack’s OTel tile |
| Datadog | Traces, metrics, logs | Not for traces | dd-api-key |
| Sentry | Traces, logs | Not documented | x-sentry-auth |
| Interfere | Traces, metrics, logs | No | Authorization: Bearer |
Sources: Honeycomb, Grafana Cloud, Datadog, Sentry, Interfere.
Transports differ. Honeycomb takes gRPC, HTTP/protobuf and HTTP/JSON. Grafana Cloud takes HTTP/protobuf, plus HTTP/JSON for low traffic, and you copy its auth header from the stack’s OpenTelemetry tile. Datadog takes HTTP, and its traces intake takes protobuf or JSON, not gRPC. Sentry uses per-signal HTTP URLs. Interfere takes HTTP/protobuf and HTTP/JSON, with no gRPC.
A few details from those pages. Honeycomb takes all three transports and lists OTLP 1.0 as its minimum for traces, metrics and logs. Grafana Cloud accepts JSON but asks you not to send it in bulk. Datadog caps payloads at 5.1 MiB uncompressed for metrics and logs and 15 MiB for traces, and answers bigger requests with 413. Sentry states that it “does not support OTLP metrics at this time”, and its trace endpoint is a full per-signal URL, so it goes in OTEL_EXPORTER_OTLP_TRACES_ENDPOINT.
Worked example: a Node service over OTLP/HTTP
Here’s a Node service sending traces to an OTLP/HTTP endpoint using only environment variables. We’ll use Interfere’s endpoint, but swap the endpoint and header and the same setup works for any backend in the table.
Install the SDK, auto-instrumentation and the http/protobuf trace exporter:
1npm install @opentelemetry/api @opentelemetry/sdk-node @opentelemetry/auto-instrumentations-node @opentelemetry/exporter-trace-otlp-protoCreate instrumentation.mjs:
1import { NodeSDK } from "@opentelemetry/sdk-node";2import { getNodeAutoInstrumentations } from "@opentelemetry/auto-instrumentations-node";3import { OTLPTraceExporter } from "@opentelemetry/exporter-trace-otlp-proto";45export const sdk = new NodeSDK({6 traceExporter: new OTLPTraceExporter(),7 instrumentations: [getNodeAutoInstrumentations()],8});910sdk.start();
The exporter takes no arguments. It reads everything from the environment:
1export OTEL_SERVICE_NAME="checkout-api"2export OTEL_EXPORTER_OTLP_ENDPOINT="https://api.interfere.com/drain"3export OTEL_EXPORTER_OTLP_PROTOCOL="http/protobuf"4export OTEL_EXPORTER_OTLP_HEADERS="Authorization=Bearer%20${INTERFERE_TELEMETRY_KEY}"5export OTEL_RESOURCE_ATTRIBUTES="deployment.environment.name=production,service.version=1.2.3"
Then load the file before your app code:
1node --import ./instrumentation.mjs dist/main.jsBecause we used the shared endpoint variable, traces go to https://api.interfere.com/drain/v1/traces. If you’d rather set OTEL_EXPORTER_OTLP_TRACES_ENDPOINT, give it that full URL.
Two things to remember. This exporter sends traces only, so logs and metrics need their own exporters. And await sdk.shutdown() in your shutdown handler, or the last batch dies with the process.
Where Interfere fits
Interfere is an error tracker for web apps that accepts OpenTelemetry traces, logs and metrics over OTLP/HTTP, ranks each problem by how many users and which customer accounts it affects, investigates the likely cause, and hands it to your coding agent over MCP.
We built it because more teams now run like software factories. Coding agents open pull requests all day, so shipping stops being the hard part. Knowing what broke, who it hit and whether the fix held becomes the hard part.
Point any OTLP/HTTP exporter or Collector at https://api.interfere.com/drain with a workspace key that has the Send telemetry permission. No Interfere SDK needed. Interfere detects new problems and regressions from production errors as they arrive, sorts them by affected users and shows which companies are hit. It writes up the likely cause tied to the release and code. Your agent picks it up over MCP and writes the fix, and Interfere tracks recovery and reopens the problem if it comes back. If you merge more pull requests than anyone can read line by line, that loop is how you keep your sanity.
The limits: no OTLP/gRPC, no profiling, no mobile SDKs, and no regional data residency yet. See the ingestion docs, Vercel OTel for Next.js and reducing MTTR, or join here.
The short of it
OTLP is a small protocol with a few sharp edges. The ports are 4317 and 4318. The shared endpoint gets paths appended and the per-signal one doesn’t. A 200 can still hide rejected records. Get those three right and most OTLP setups just work.