Levi Gans
Root cause analysis means different things depending on who’s asking. In a factory it’s a fishbone diagram and five whys. In software it’s the question you ask when production breaks: what changed, and why did it do this?
For most of the job’s history, answering that meant opening five tabs. The error tracker had the stack trace, the APM tool had the slow span, the deploy log had the commit, and someone had to hold all of it in their head long enough to connect the dots. AI root cause analysis tools do the connecting. They pull the evidence together, propose a cause, and more and more often hand you or your coding agent a fix.
Whatever the tool, the loop looks roughly like this:
- Something breaksan error, alert or incident
- Gather the evidenceerrors, traces, logs, deploys
- Connect it to a changerelease, pull request, commit
- Explain the causewith the evidence behind it
- Write the fixyou, the tool or your agent
- Confirm it stayed fixedand reopen if it comes back
The tools come at it from three directions. Error trackers start from a single bug and your code. Observability platforms start from an anomaly in your telemetry and follow the dependency graph. AI SRE agents join the incident itself and investigate across whatever tools you already run. Which one fits depends less on the AI than on where your problems tend to start.
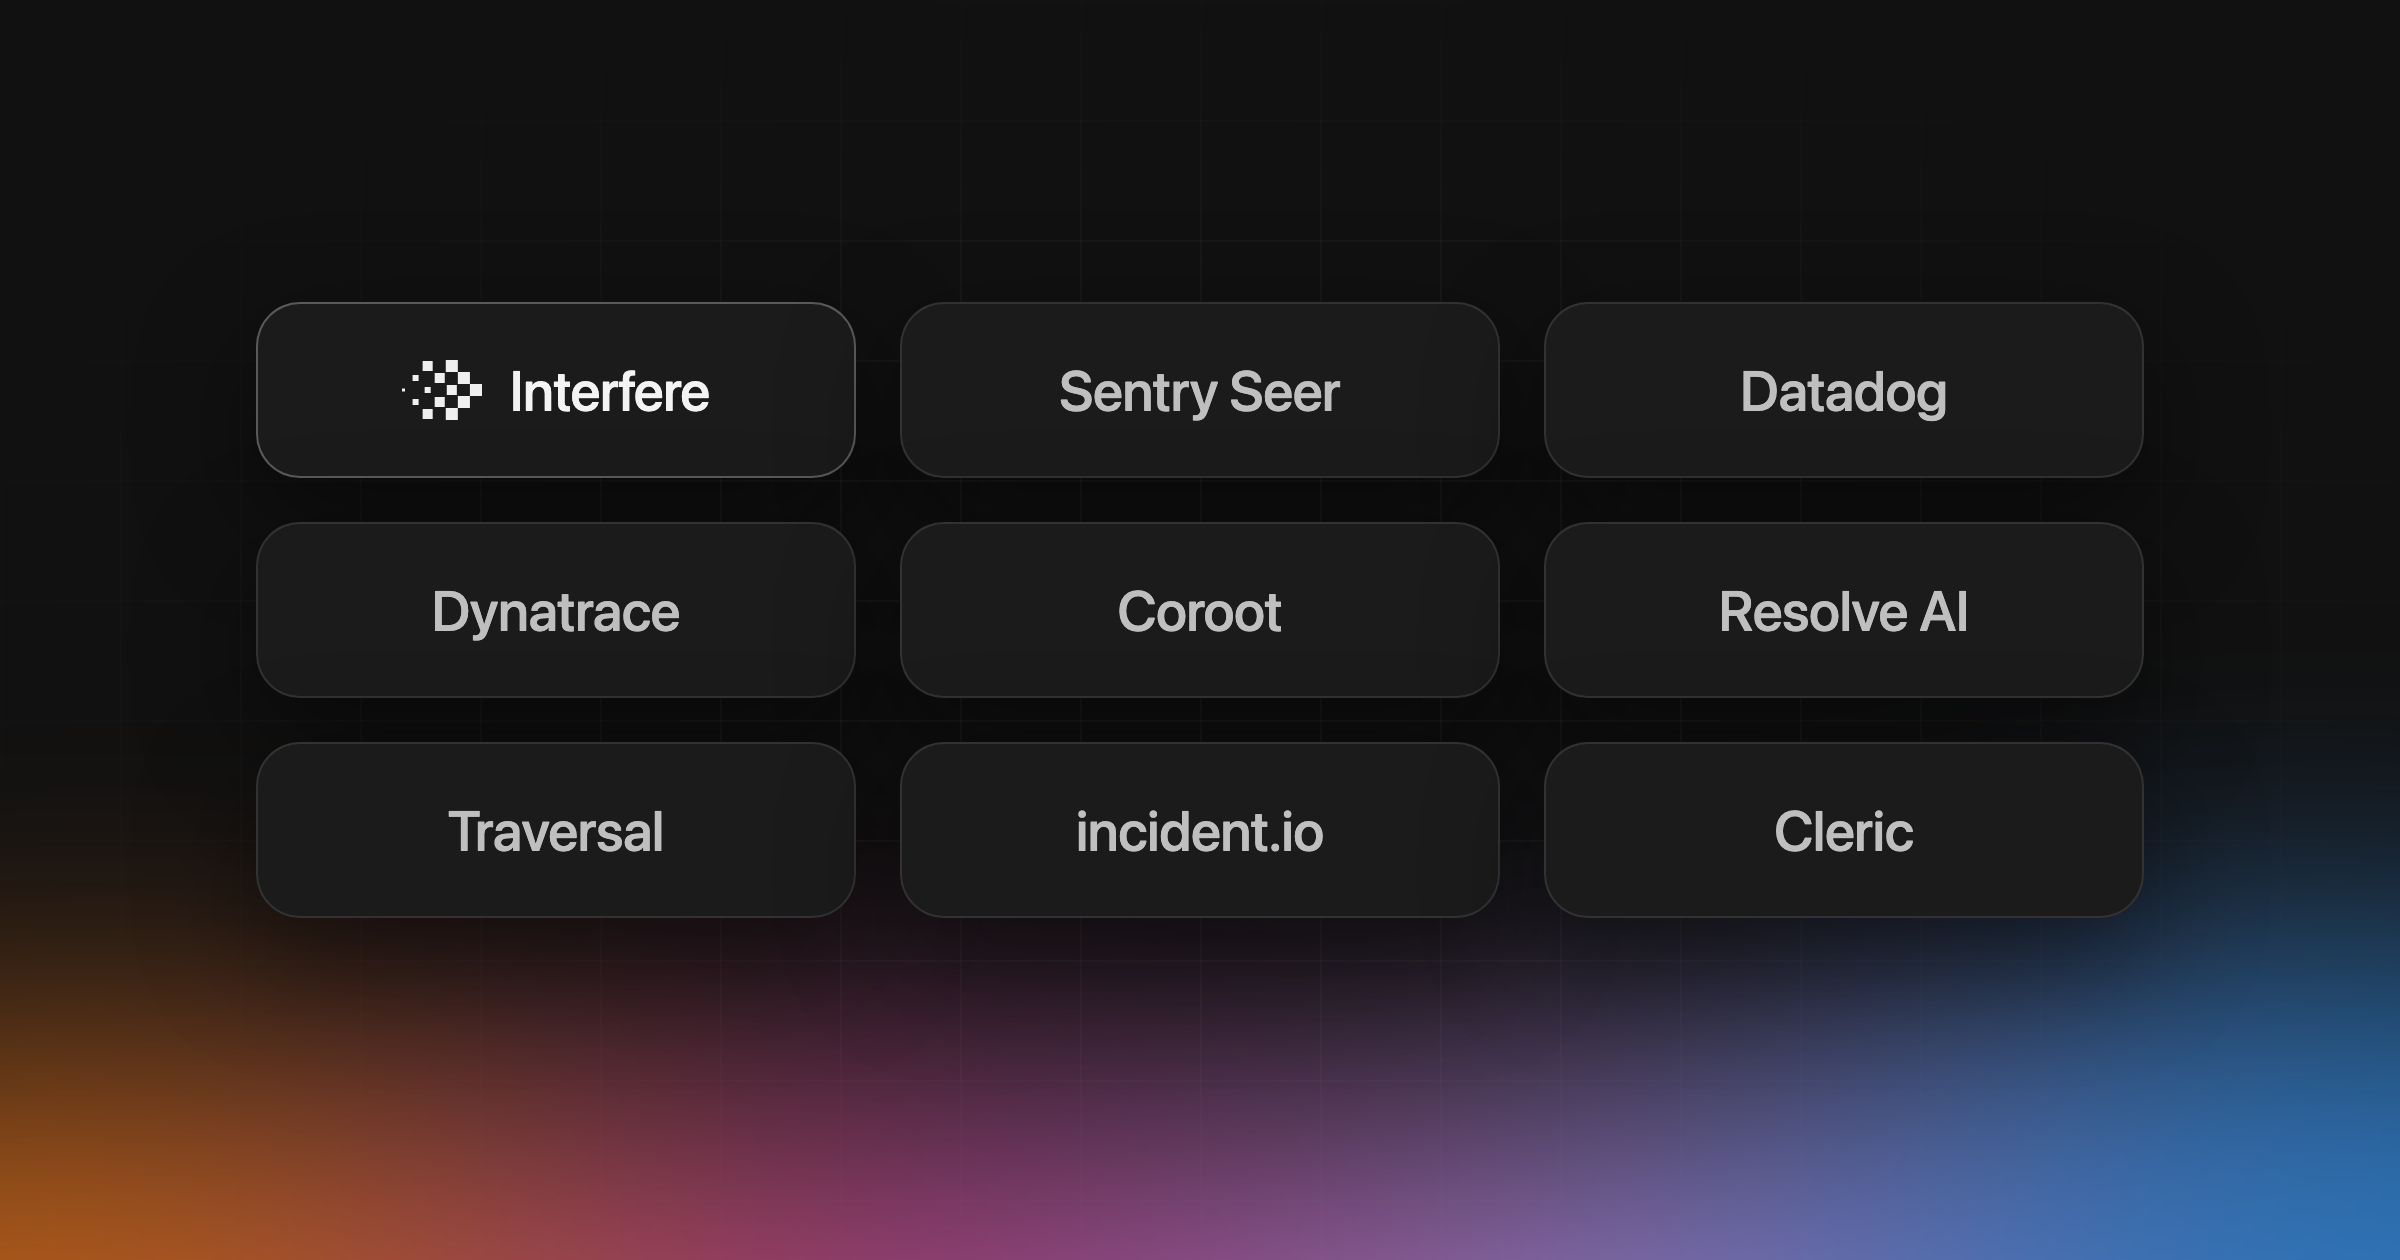
We build Interfere, so we’re on this list. We compared nine tools using each vendor’s own documentation.
At a glance
| Tool | Starts from | Investigates | Writes the fix |
|---|---|---|---|
| Interfere | Errors and sessions in your web app | Errors, sessions, traces and releases | Suggests one, and opens a pull request if you turn it on |
| Sentry Seer | A Sentry issue | Issue details, traces, logs, profiles and your code | Proposes one or opens a pull request |
| Datadog | An APM anomaly or a monitor alert | APM, infrastructure metrics, logs, RUM, Error Tracking and code | Bits Code generates it |
| Dynatrace | A detected problem | Events, logs, metrics, traces and the dependency graph | Proposes fixes or rollbacks, in preview |
| Coroot | An anomaly you select | Metrics, logs, traces and profiles | No, it suggests remediation steps |
| Resolve AI | An alert or an incident channel | Code, infrastructure, telemetry and team knowledge | Can generate pull requests |
| Traversal | An alert or an incident | Metrics, logs, traces, deployments, topology and code | Proposes the fix or applies it |
| incident.io | A declared incident | Alerts, past incidents, runbooks, code, changes and telemetry | A pull request, only on request by default |
| Cleric | An alert or a merged change | Logs, metrics, Kubernetes, alerts, code and deploys | Brings a fix pull request to review |
All nine have an MCP server, so your own coding agent can reach any of them. That’s no longer what separates them. Where they start, and what they can see from there, is.
Tools that start from the bug
These start from one error in your app and work back through your code. They’re the quickest route when your problems show up as bugs rather than outages.
Interfere
Interfere is a fundamentally different tool, built for the new era of software factories. Most tools on this list wait for something to go wrong in a dashboard. Interfere starts where the bug starts, in the browser and on the server of your web app.
It groups errors, sessions and traces into problems and ranks each one by its blast radius: the users and companies it affects. Each problem comes with findings that point to the release, pull request and commit most likely behind it.
Every problem also comes with a suggested fix. Interfere can open the pull request too, but that setting is off when you start. Claude Code, Cursor or Codex can pick up the same investigation through the MCP server and start from the root cause instead of a stack trace.
After the fix ships, Interfere keeps watching, and reopens the problem as a regression if it comes back. It’s built for web apps on Next.js, React, Vite and TanStack Start, not for infrastructure, so if your incidents start in Kubernetes or the network, look further down.
Sentry Seer
Seer is Sentry’s debugging agent, and it works one issue at a time. It reads the issue’s traces, logs and profiles alongside your code, and shows its reasoning live on the issue page.
It runs by itself once an issue has enough recent events and looks fixable, or whenever you ask. Autofix can then open a pull request or hand the work to Claude Code, Cursor or GitHub Copilot, on GitHub.com and GitLab.com only.
If you already use Sentry, start here. Sentry Seer alternatives compares it with six other ways to get AI fixes.
Tools that start from your telemetry
Observability platforms already hold your metrics, logs and traces. Their root cause analysis starts from an anomaly and follows the dependencies between your services.
Datadog
Watchdog RCA runs by itself when it spots an anomaly in APM, and lays out the root cause, the critical failure and the impact. It needs APM to work.
Bits Investigation, formerly Bits AI SRE, is the agent. It starts from a monitor alert and can pull in RUM, Error Tracking, your source code and data from tools like Sentry and Grafana. With your code connected, Bits Code can write the fix.
If your telemetry already lives in Datadog, start here.
Dynatrace
Dynatrace’s root cause analysis runs all the time. It reads your telemetry against Smartscape, its map of how your services depend on each other, and ties it to code changes, deployments and configuration updates.
Events that share a cause become one problem, which updates as it develops. Workflows that propose fixes or rollbacks are in preview. It’s built for large multi-cloud and Kubernetes estates, where understanding the topology is most of the job.
Coroot
Coroot is the open-source option, hosted on your own Kubernetes, Docker or Linux machines. Its root cause analysis follows the dependency graph using machine learning, not a language model.
A model only comes in when you choose Explain with AI, and it sees Coroot’s findings rather than your raw data. It suggests remediation steps, not code. AI analysis needs the Enterprise edition, or the free Community Edition connected to Coroot Cloud, with 10 investigations a month.
Tools that start from the incident
AI SRE agents take the alert, or join the incident, and investigate across the tools you already run. They suit teams with an on-call rotation and incidents that cross many systems.
Resolve AI
Resolve AI takes the first look at incidents. It investigates alerts as they fire, joins incident channels in Slack and Microsoft Teams, and drafts the postmortem afterwards.
It works across your code, infrastructure and telemetry, plus your runbooks, wikis and chat, and it can generate pull requests. Its customers include Coinbase, DoorDash and Zscaler, which tells you who it’s built for.
Traversal
Traversal aims at very large systems, with petabytes of logs. It detects incidents itself and works out the cause, with a timeline and the blast radius.
It’s read-only by default, needs no agents or sidecars, and can propose the fix or apply it. You can run it as SaaS or in your own cloud, and getting started means booking a demo.
incident.io
Investigations start the moment you declare an incident in incident.io. They post a root cause into the incident channel, with the evidence, a confidence level and next steps.
The only change Investigations can make to your systems is a pull request you review and merge yourself. It fits best if you already run incidents in incident.io.
Cleric
Cleric takes the pager. It triages alerts, closes the false positives and investigates the rest, then comes back with the cause, the evidence and a fix pull request.
It also checks every merged change for 14 days after it ships, which matters more as coding agents write a bigger share of the code. It runs as single-tenant SaaS, read-only by default, with a free trial.
Choosing between them
Start from where your problems start.
If they show up as errors in a web app, a tool that begins with the bug and your code gets to the cause fastest: Interfere, or Seer if you’re on Sentry.
If they start as anomalies in services and infrastructure, use the analysis built into the platform that already has your telemetry. That means Datadog or Dynatrace, or Coroot if you’d rather host it yourself.
If your incidents cross many teams and tools and you want an agent in the incident channel, look at Resolve AI, Traversal, incident.io or Cleric.
Whichever you choose, check two things before you trust it: whether it shows the evidence behind its conclusion, and whether it tells you when a fix didn’t work.
From correlation to root cause
A spike in errors right after a deploy is a correlation. It tells you where to look, not what broke, and it’s how most war rooms start: a dozen people looking at the same graph, each holding one piece of the story.
Interfere is built to hold every piece at once. It reads the errors and the sessions behind them, the traces and logs from your app, the deployments and releases that shipped each change, and the source code those changes touched. From that it works out the root cause, the evidence behind it, and the blast radius: the users and companies the problem actually reached. Then it suggests the fix.
Nobody has to open five tabs or rebuild the timeline from memory. The investigation is done by the time someone looks, and it’s the same one your coding agent reads over MCP.
If you build web apps and want the root cause waiting before anyone has to ask, try Interfere.